Juan Madrigal

Data analyst with expertise in Power BI, Tableau, Python, and SQL, seeking an individual contributor role in data and marketing analytics. Experienced in data integration and data validation, analysis of donor information, and reporting. Strong foundation in statistics, marketing, and data visualization. Committed to continuous learning and professional growth, leveraging extensive experience in both educational and B2C web marketing contexts.

Revenue Operations Assessment

Download the Excel files below to view the sample revenue and bonus data.

Revenue Operations Analyst Assessment

  1. Determine the commission earned by each of the four Account Executives, all of whom are on annual compensation plans with commission-based structures. Commission rates is calculated based on their Revenue attainment percentage at the time of booking. Details on Quota and Plan is on Tab “Commission Rate and Quota”.
  2. Please input commission rate and commission earned in Columns K and L on the Data Tab.
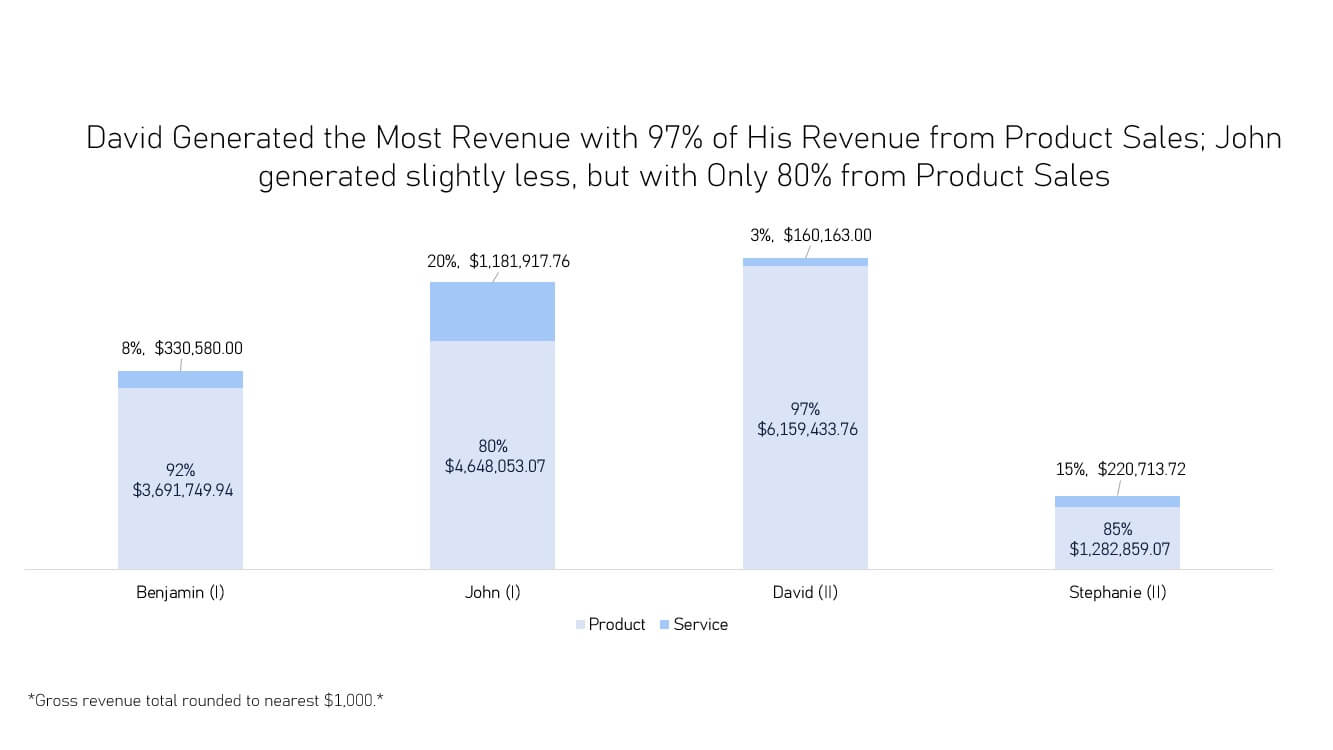
  3. Please list total commission by rep by Product and Service
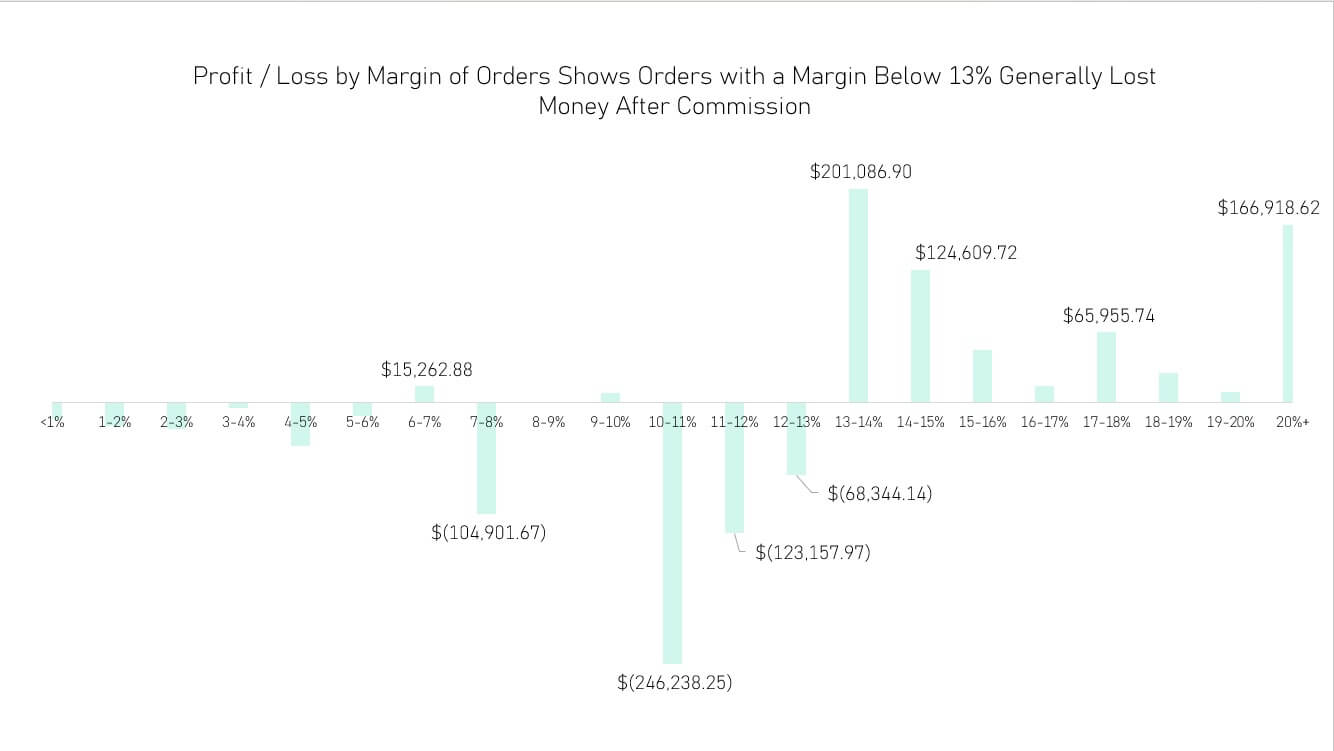
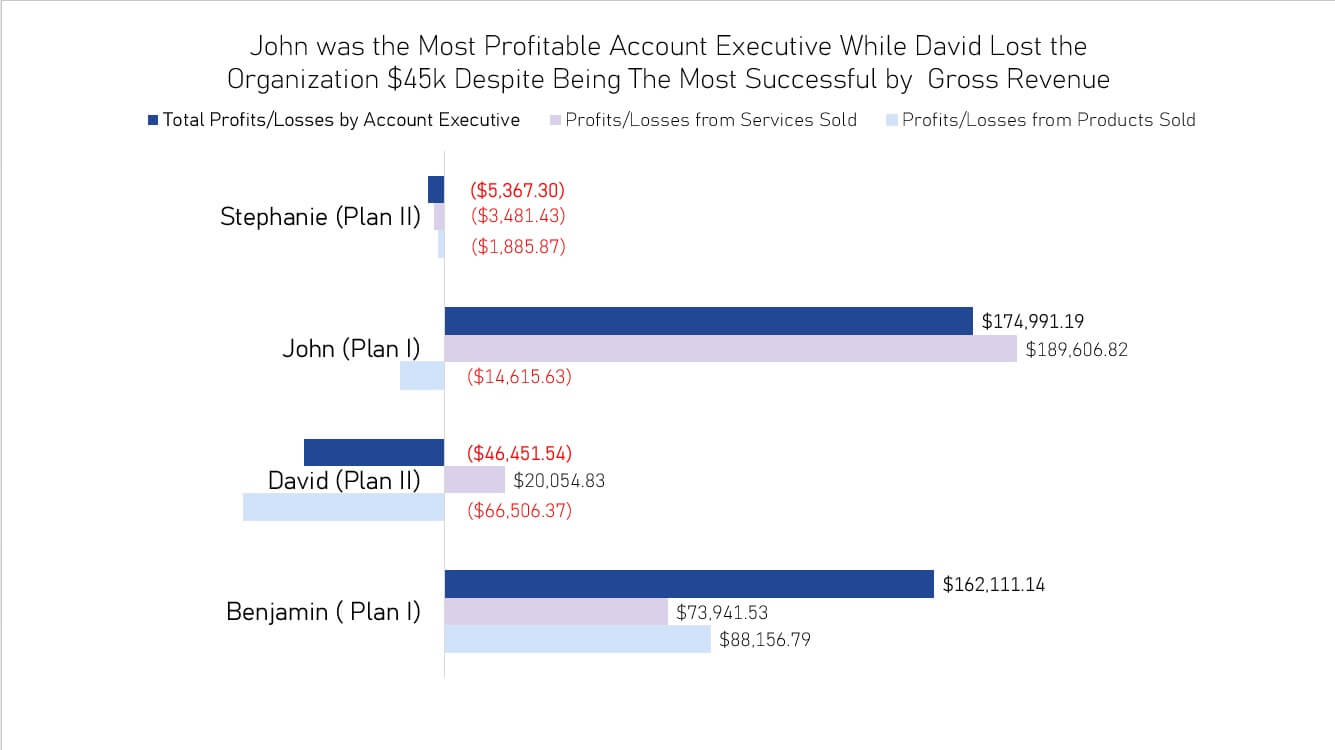
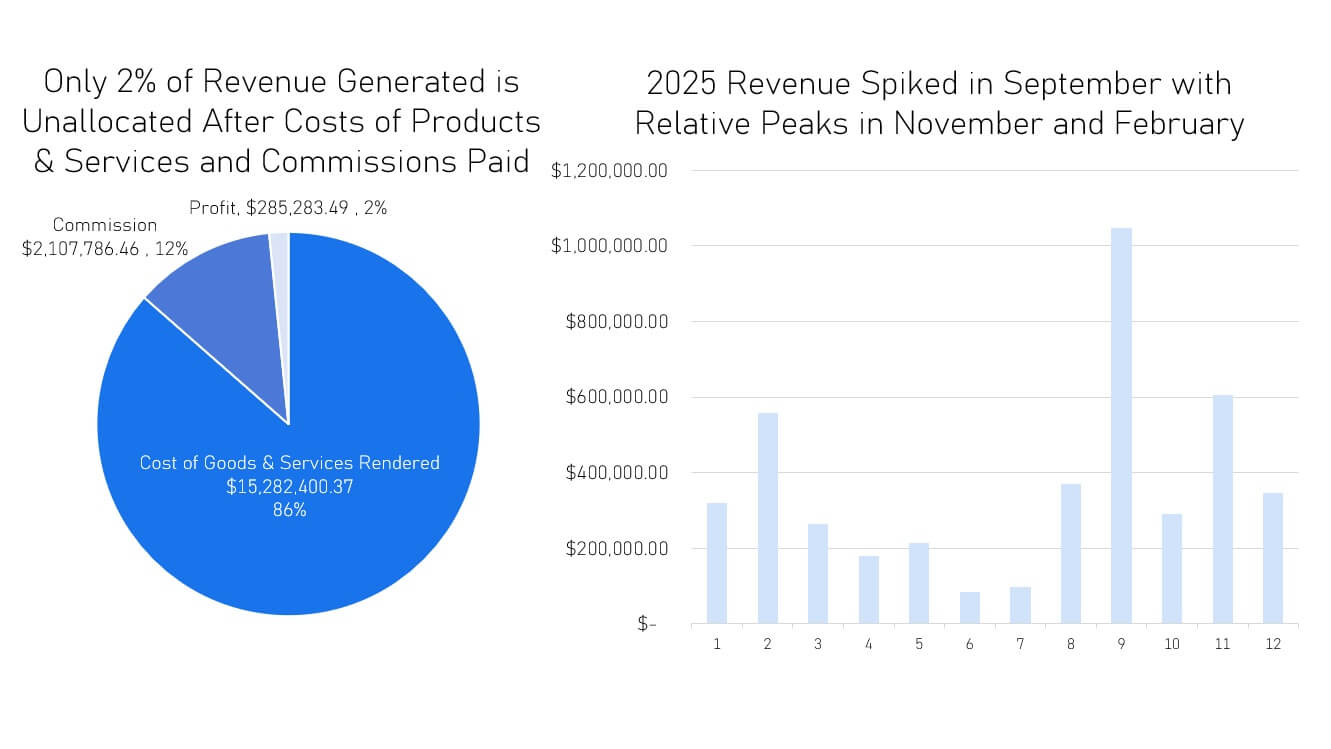
  4. What insights can be drawn from this data?
  5. Benjamin Lee is challenging their commission, claiming that you miscalculated. Describe how you would you validate the claim, communicate with Account Executive, and document the resolution process.
  6. Prepare 1 to 3 slides summarizing your assessment and proposed recommendations. Your slides should address:
Key Observations:
  • Any concerns or inefficiencies in the existing plan
  • Recommended changes (if any) and the rationale behind them
  • Potential impact on behavior and company goals

You may use visuals, charts or data summaries to support your recommendations.

Account ExecutivePlanProduct QuotaService Quota
Benjamin LeePlan I2,953,399247,935
David JonesPlan II3,695,661115,317
John SmithPlan I3,486,039827,342
Stephanie JonesPlan II833,858143,463
Plan ICommission Rates
Attainment % TIERSPRODUCTSERVICE
0%50%7%10%
50%75%9%13%
75%90%10%14%
90%100%16%23%
100%125%18%25%
125%END20%28%
Plan IICommission Rates
Attainment % TIERSPRODUCTSERVICE
0%50%5%8%
50%75%7%11%
75%90%8%12%
90%100%14%21%
100%125%16%23%
125%END18%26%
Sample Payroll Project Prepared by Juan Madrigal Graph titled: David Generated the Most Revenue with 97% of His Revenue from Product Sales; John generated slightly less, but with Only 80% from Product Sales Profit / Loss by Margin of Orders Shows Orders with a Margin Below 13% Generally Lost Money After Commission
Profit / Loss by Margin of Orders Shows Orders with a Margin Below 13% Generally Lost Money After Commission
Only 2% of Revenue Generated is Unallocated After Costs of Products & Services and Commissions Paid, 2025 Revenue Spiked in September with Relative Peaks in November and February.

Recommendations

  • A sample size of two account executives per plan is too small to make any definitive conclusion about the effectiveness of either plan. I would recommend continuing to record data with a wider array of account executives. Recommendations also depend on the context of the organization. For example, a young organization with outside funding may focus on gross revenue over profits.
  • 175 products sold had no margin; while almost every order had a positive margin overall, after commission is factored in, many orders incurred a loss. Two of David's sales were negative margins of more than $10,000 with revenue totals of more than $100,000.
  • Only 1 service had no margin. This service was $324,859.56 from John Smith, netting him a commission of $45,480. Records show this was the only sale to this customer. Even factoring in this service, however, John earned the company more net revenue than any other exec, and earned the second most total revenue of any exec.
  • Minimum margins for orders of 13% or anchoring product commission rates to a service quota are both ways to minimize losses, but each policy may negatively impact gross revenue. More information is needed to make definitive recommendations.